Maize yield prediction and condition monitoring at the sub-county scale in Kenya: synthesis of remote sensing information and crop modeling

A new study in Kenya combines remote sensing and crop growth modeling to improve maize yield predictions. Using data from the FAO’s WaPOR portal, researchers accurately estimated sowing dates and modeled phenology and evapotranspiration (ET) at sub-county scales in Trans Nzoia and Uasin Gishu. Results showed strong correlations (R² > 0.6) between modeled and observed data, particularly in humid areas, enhancing yield prediction accuracy and providing valuable insights for agricultural resource management.
Abstract
Agricultural production assessments are crucial for formulating strategies for closing yield gaps and enhancing production efficiencies. While in situ crop yield measurements can provide valuable and accurate information, such approaches are costly and lack scalability for large-scale assessments. Therefore, crop modeling and remote sensing (RS) technologies are essential for assessing crop conditions and predicting yields at larger scales. In this study, we combined RS and a crop growth model to assess phenology, evapotranspiration (ET), and yield dynamics at grid and sub-county scales in Kenya. We synthesized RS information from the Food and Agriculture Organization (FAO) Water Productivity Open-access portal (WaPOR) to retrieve sowing date information for driving the model simulations. The findings showed that grid-scale management information and progressive crop growth could be accurately derived, reducing the model output uncertainties. Performance assessment of the modeled phenology yielded satisfactory accuracies at the sub-county scale during two representative seasons. The agreement between the simulated ET and yield was improved with the combined RS-crop model approach relative to the crop model only, demonstrating the value of additional large-scale RS information. The proposed approach supports crop yield estimation in data-scarce environments and provides valuable insights for agricultural resource management enabling countermeasures, especially when shortages are perceived in advance, thus enhancing agricultural production.
Introduction
The increasing global population and adverse climate impacts are among the main threats to future food security1. In sub-Saharan Africa (SSA), the maize output must be increased fourfold to meet its self-sufficiency demand by 20502. Given the future climatic conditions and existing challenges affecting production, the above projected estimate may not be feasible, thus hampering future food security efforts in the continent. Biotic and abiotic influences might result in low production and insufficient food for the rising population in SSA. As a counteractive measure, governments, policy-makers, and researchers should deploy the necessary technologies to better understand and avert the decline in future production while equally maximizing the available opportunities to enhance production3. Among these strategies, agricultural production assessment and crop condition monitoring studies at diverse spatial scales are useful for identifying marginally productive areas and identifying opportunities for optimizing production.
Information on crop conditions, growth and production estimates is important to agricultural extension workers, planners, and governments. Such information can be obtained through field experiments and surveys conducted at the household and field levels. Although these approaches have gained increasing relevance in agricultural policy-making, they are costly, especially when conducted at large scales. As an alternative, crop modelling and remote sensing (RS) have been proposed to explore crop conditions and the response of various agronomic measures at relatively low costs4. Although these two techniques can be applied independently, their synergistic combination complements their respective strengths, facilitating more robust analysis of agricultural landscapes. For example, RS provides synoptic coverage of the crop status from quantifiable crop condition proxies and estimators of reflectances in specific spectral bands and indices5. One important feature of vegetation progression that can be detected through RS is the land surface phenology (LSP). LSP reflects the distinct cyclic pattern of the change in terrestrial vegetation species6. Exploring LSP offers opportunities for improving cropland monitoring processes and influences. Similarly, crop models can be used to simulate crop growth and development under diverse environmental conditions and agronomic management practices. The application of these tools focuses more on the biological and physiochemical interactions in the plant‒soil‒atmosphere continuum and entails incorporating several parameters to model various plant processes7.
In recent decades, there has been an increase in crop growth simulation models used in agricultural planning and decision-making. The models are categorized widely as carbon-driven, water-driven or radiation-driven based on the driving mechanism8. The Decision Support Systems for Agrotechnology Transfer (DSSAT)-CERES-Maize model is one of the simulation models falling under the radiation-driven category as it derives plant biomass from intercepted solar radiation and incorporates the radiation use efficiency (RUE) coefficient9. The dynamic simulation model for the maize crop is among the larger family within the DSSAT group of models. The model has shown a remarkable capability for characterizing production in diverse environments10,11. It simulates leaf area index (LAI) and root growth variables. It also simulates ET processes, nitrogen dynamics and soil water balance. Furthermore, the model integrates plant-soil-atmosphere processes and outputs variables, including biomass, yield and other variables related to crop production. In simulating the above variables, the model uses algorithms representing various plant, soil and atmosphere processes to describe plant growth and development. The model simulates processes such as ET using the Priestley-Taylor (PT) and FAO-56 Penman–Monteith (PM) options8.
Combining crop modeling and RS provides opportunities for assessing crop conditions and production, especially in data-scarce environments. These techniques can be coupled to provide an improved understanding of the underlying environmental processes and cropland status at any given time during the growing season. The advantage of the latter is that it captures the variability in croplands as moderated by climatic effects and socioeconomic factors. In this way, information can easily be integrated into crop modeling frameworks for simulating daily growth and development12. Furthermore, Gao et al.13 noted the reliability of sensor products for deriving within-season phenological information, including sowing dates.
In existing studies, RS and crop models have been coupled to study maize conditions and development in diverse regions14,15,16. In these studies, various biophysical variables derived from RS have been integrated and assimilated into crop modeling platforms. These assimilation studies have been extensively covered in the literature; however, little research has focused on the retrieval of agronomic management information. Few studies on the derivation of agronomic management information from RS data have confirmed the reliability of data sources in crop model simulations. For example, Rezaei et al.12 showed that sowing dates could be derived from Moderate Resolution Imaging Spectroradiometer (MODIS) satellite data, although with minimal uncertainties. Moreover, Leo et al.17 showed the significance of RS information in deriving management zone information and optimizing management, for example, fertilizer application using crop modeling. Other researchers have used RS to evaluate management information retrieval18,19. However, more research is still needed to improve the estimation of crop model inputs using RS data and to provide a greater understanding of the yield variation at various spatial scales. Furthermore, assessing the model performance in simulating ET at large scales is yet to be addressed. This study, therefore, bridges these research gaps in three aspects. First, the aim of this study is to derive important phenological information from RS and integrate it with the DSSAT-CERES-Maize model for yield prediction. The second objective is to evaluate the integration approach at the sub-county level, the yield-reporting scale in Kenya. The final objective of the study is to evaluate the performance of the DSSAT-CERES-Maize model in simulating ET and examine the implications of the performance on yield prediction at the sub-county scale. The study is important in providing county and national governments and decision-makers in the agricultural sector with an effective approach to yield estimation using state-of-the-art and low-cost technologies towards improved crop production and food security.
Materials and methods
Study area
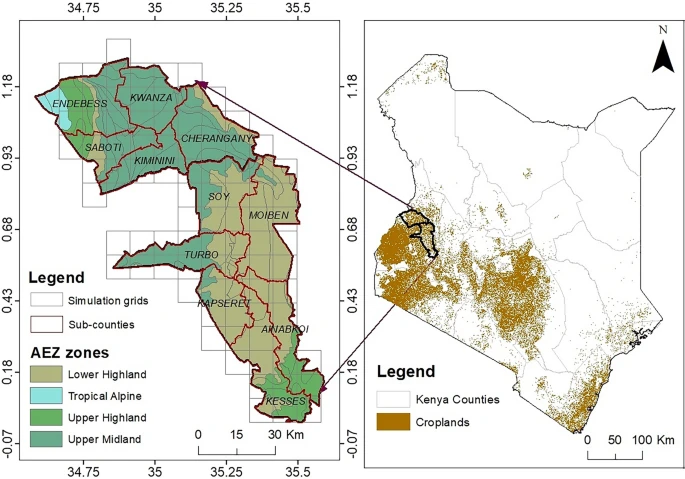
This analysis was performed for the sub-counties of Trans Nzoia and Uasin Gishu Counties in northwestern Kenya (Fig. 1), collectively covering an area of 5430 km2 and producing approximately 30% of the total maize harvest in Kenya20. Rainfed farming is the dominant cultivation pattern of maize and other crops in the study area. The annual precipitation in the region varies between 900 and 1800 mm. The rainfall pattern is bimodal, with long rains experienced between March and July, whereas short rains occur between October and December. The annual mean temperature varies between 9 and 26 °C. The altitudinal range is high in Trans Nzoia County (1500–4226 m above sea level), while in Uasin Gishu, the altitude ranges from 1500 to 2800 m. The dominant economic activity in the rural and peri-urban areas is agriculture, with crop farming and livestock rearing practised.
Remote sensing-based land surface phenology
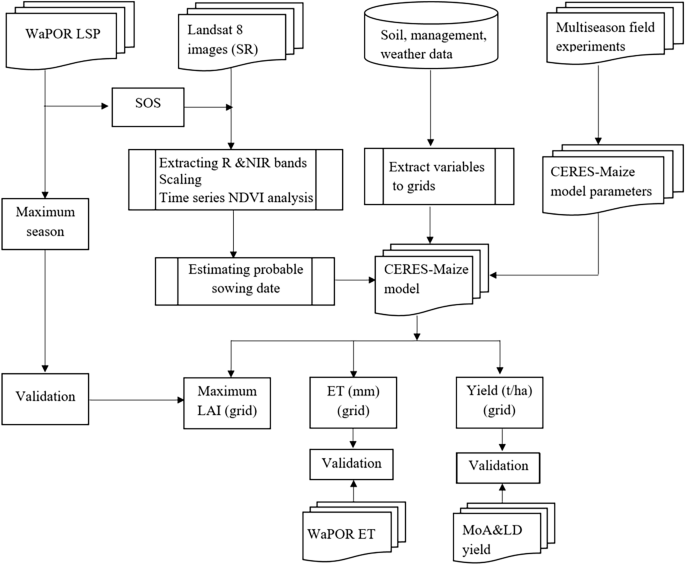
The land surface phenology (LSP) from 2017 to 2021 was derived from RS data. The selected period corresponds with the availability of the observed yield data at the sub-county level to allow for model performance assessment. Satellite LSP derivations can capture the cyclic pattern of the change in terrestrial vegetation6. Thus, important indicators of crop growth, such as the emergence date, start of the season (SOS), maximum season (MS), and end of the season (EOS), can be derived. In this study, we utilized the seasonal phenology data obtained from the Food and Agricultural Organization (FAO), delivered through the Water Productivity Open-access portal (WaPOR) portal. The WaPOR portal delivers processed satellite information, including seasonal phenology used to monitor water and land productivity at various regional scales. Multisource LSP data were used to estimate the probable sowing dates at the grid scale. LSP in the WaPOR data is represented by the SOS, MS, and EOS temporal attributes. The data were created from a time series of normalized difference vegetation index (NDVI) composites from Proba-V and Sentinel-2 images. The Proba-V satellite data covered 2009 to 2019. However, from 2019 onwards, the base NDVI layers were derived from the Copernicus Sentinel-2 mission following the decommissioning of the Proba-V satellite. The seasonal cycles of the WaPOR LSP data are delivered using raster files, with each file indicating a dekadal value showing when the respective season was attained. According to the WaPOR data, the NDVI time series covers exactly three calendar years, equivalent to 108 dekads. The target year in the data occurs in the middle (dekad 37–72). Thus, for a given target year, dekad 37 corresponds to the first ten days of January, and dekad 72 corresponds to the last ten days of December. We downloaded and processed the raster files to derive SOS, MS and EOS for each simulation grid. The methodology followed in this study is summarized in Fig. 2.
Additionally, time series of the NDVI from the Landsat 8 OLI/TIRS sensor were derived for each grid in the study area. Landsat data provided additional temporal information on crop growth progress before the SOS. This information is crucial to estimate the probable sowing window. We fitted a harmonic function to the time series of NDVI data to overcome the problem of noise and gaps in the time series data. The harmonic function models the temporal signal of the NDVI as the sum of additive and harmonic terms, which are then expressed by phase and amplitude21. The analysis of temporal patterns of NDVI was performed in the Google Earth Engine platform22. The NDVI and WaPOR datasets were evaluated for the condition that the sowing date in each grid must occur before the SOS, as the SOS indicates the time lag after sowing (Fig. 3). Thus, the sowing date for each grid was estimated as the lowest point on the curve (zero gradient) before SOS attainment. False minor peaks before the estimated probable sowing date were ignored as they could probably indicate the re-growth of weeds after land preparation23. As each grid comprises several pixels, the median value was assumed as the probable sowing date for a given grid.
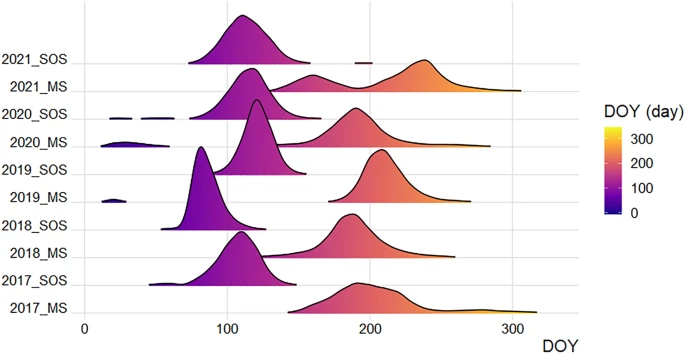
The derived sowing dates were then used as input to drive the DSSAT-CERES-Maize simulations. The density distribution of the WaPOR SOS and MS for maize pixels in the study area is shown in Fig. 4.
DSSAT-CERES-Maize modeling
The estimated sowing dates for each grid were used as model input data for the DSSAT-CERES-Maize model. Combined with other model input files, including soil and weather data, the model could be used to simulate the phenology, leaf area index (LAI), biomass and yield during the growing season. For reliable simulations and characterization of crop growth and development, it is paramount that the processes that drive the crop model outputs must be represented as accurately as possible. Thus, the model should be parameterized and evaluated under nonlimited water and nitrogen stress conditions. In a recent study in the study area, on-farm experiments were conducted to parameterize and evaluate the DSSAT-CERES-Maize model24. The model was parameterized using observed weather and soil data for 82 fields during two maize-growing seasons in Trans Nzoia County, which is part of the scope of this study. Daily weather variables, including solar radiation, precipitation, and daily maximum and minimum temperatures, were obtained from local weather stations in the study area. Additionally, soil sampling and analysis were conducted in each field to quantify the soil physical and chemical characteristics. The model was run using the parameterized cultivar coefficients to simulate the phenological development, LAI, and yield in the various maize grids. The model simulates phenological development, including the number of days needed to attain anthesis and physiological maturity25. These attributes, together with the seasonal progression of the LAI, can be used to infer crop growth progress. In this study, we used the simulated maximum LAI value as an indicator for the peak season. Thus, the value was compared against RS MS observations from archived sources such as WaPOR. Additionally, the simulated yield was aggregated to the sub-county scale and compared to the observed yield to assess the model robustness in representing the yield at larger scales.
Evaluation of DSSAT-CERES-Maize phenology and yield simulations
The maize phenology simulated by the DSSAT-CERES-Maize model was compared to the MS phenology obtained from RS data during the two seasons. The accuracy metric of the coefficient of determination (R2) was used to evaluate the DSSAT-CERES-Maize-simulated and RS-derived LSP values during the peak season. Furthermore, the simulated and observed maize yields were compared at the field and sub-county scales.
Evaluation of the DSSAT-CERES-model simulated evapotranspiration
In this study, we also assessed the potential of the DSSAT-CERES-Maize model in simulating ET at the grid scale. The soil water balance module of the model is the driver behind ET estimation, usually partitioned into water lost through evaporation and transpiration26. The partitioned components are then modified by the extractable water and root growth to determine the crop evapotranspiration (ET). In this study, we adopted the PT method to estimate the potential ET. The technique uses solar radiation and temperature to calculate ET. The method is recommended for humid environments, a characteristic of the study area.
The DSSAT-CERES-Maize ET simulations were compared to the WaPOR retrieved datasets for the study area. The product has been evaluated across Africa with in situ data obtained from multiple eddy covariance (EC) stations and found to exhibit satisfactory agreement27. The advantage of this product is that it provides extensive coverage over Africa and the Middle East, enabling low-cost, large-scale assessments in data-scarce environments. Therefore, the cumulative ET over the growing season in each grid was compared to cumulative ET observations from the WaPOR data. Since the WaPOR data are provided on dekadal temporal scales, raster functions were used to compute the WaPOR-derived ET for each grid over the entire season. The evaluation was conducted for all five growing seasons in this study, spanning different weather and plant water availability regimes.
Read more: https://www.nature.com/articles/s41598-024-62623-w