Asia-Pacific’s Paddy Rice Market to Reach 784M tons by 2035,Valued at $825.3B
Asia-Pacific’s paddy rice market is forecast to grow steadily, reaching 784M tons by 2035 at a +0.9% CAGR. Despite a slight decline in 2024, China, India, and Bangladesh dominate consumption and production. Cambodia leads regional exports, while Vietnam tops imports. Rising global demand and stable production are set to drive market expansion and price resilience.
Market Forecast
Driven by increasing demand for paddy rice in Asia-Pacific, the market is expected to continue an upward consumption trend over the next decade. Market performance is forecast to retain its current trend pattern, expanding with an anticipated CAGR of +0.9% for the period from 2024 to 2035, which is projected to bring the market volume to 784M tons by the end of 2035.
In value terms, the market is forecast to increase with an anticipated CAGR of +1.3% for the period from 2024 to 2035, which is projected to bring the market value to $825.3B (in nominal wholesale prices) by the end of 2035.
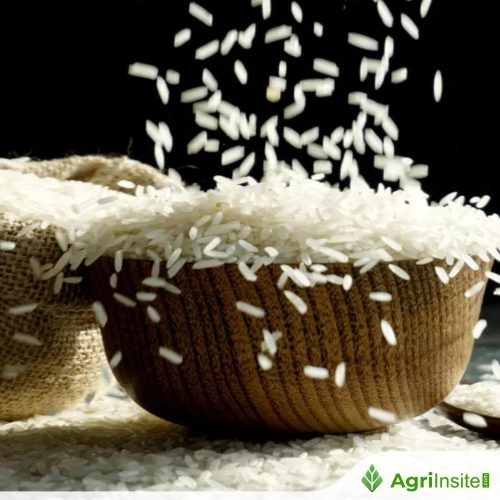
Consumption
Asia-Pacific’s Consumption of Paddy Rice
After four years of growth, consumption of paddy rice decreased by -0.4% to 709M tons in 2024. Over the period under review, consumption, however, showed a relatively flat trend pattern. The pace of growth was the most pronounced in 2021 when the consumption volume increased by 2.3% against the previous year. Over the period under review, consumption hit record highs at 712M tons in 2023, and then fell modestly in the following year.
The revenue of the paddy rice market in Asia-Pacific rose sharply to $719.7B in 2024, increasing by 5.9% against the previous year. This figure reflects the total revenues of producers and importers (excluding logistics costs, retail marketing costs, and retailers’ margins, which will be included in the final consumer price). In general, consumption, however, saw a relatively flat trend pattern. The level of consumption peaked at $730.9B in 2015; however, from 2016 to 2024, consumption stood at a somewhat lower figure.
Consumption By Country
The countries with the highest volumes of consumption in 2024 were China (208M tons), India (205M tons) and Bangladesh (58M tons), with a combined 66% share of total consumption.
From 2013 to 2024, the biggest increases were recorded for India (with a CAGR of +2.3%), while consumption for the other leaders experienced more modest paces of growth.
In value terms, China ($262.3B) led the market, alone. The second position in the ranking was taken by Bangladesh ($98.4B). It was followed by India. From 2013 to 2024, the average annual growth rate of value in China was relatively modest. In the other countries, the average annual rates were as follows: Bangladesh (+3.6% per year) and India (+4.0% per year).
The countries with the highest levels of paddy rice per capita consumption in 2024 were Myanmar (478 kg per person), Thailand (475 kg per person) and Vietnam (436 kg per person).
From 2013 to 2024, the most notable rate of growth in terms of consumption, amongst the leading consuming countries, was attained by India (with a CAGR of +1.3%), while consumption for the other leaders experienced mixed trends in the per capita consumption figures.
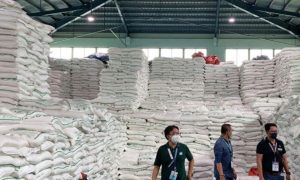
Production
Asia-Pacific’s Production of Paddy Rice
In 2024, production of paddy rice decreased by -0.4% to 709M tons for the first time since 2019, thus ending a four-year rising trend. Overall, production, however, saw a relatively flat trend pattern. The most prominent rate of growth was recorded in 2021 when the production volume increased by 2.5% against the previous year. The volume of production peaked at 712M tons in 2023, and then declined slightly in the following year. The general positive trend in terms output was largely conditioned by a relatively flat trend pattern of the harvested area and a relatively flat trend pattern in yield figures.
In value terms, paddy rice production rose remarkably to $728.6B in 2024 estimated in export price. In general, production, however, continues to indicate a relatively flat trend pattern. The most prominent rate of growth was recorded in 2017 when the production volume increased by 20% against the previous year. Over the period under review, production attained the peak level at $745.3B in 2015; however, from 2016 to 2024, production stood at a somewhat lower figure.
Production By Country
The countries with the highest volumes of production in 2024 were China (208M tons), India (205M tons) and Bangladesh (58M tons), together accounting for 66% of total production.
From 2013 to 2024, the most notable rate of growth in terms of production, amongst the leading producing countries, was attained by India (with a CAGR of +2.3%), while production for the other leaders experienced more modest paces of growth.
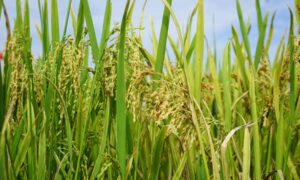
Yield
In 2024, the average paddy rice yield in Asia-Pacific shrank slightly to 5 tons per ha, approximately mirroring 2023. Over the period under review, the yield, however, saw a relatively flat trend pattern. The pace of growth appeared the most rapid in 2018 with an increase of 1.6%. Over the period under review, the paddy rice yield reached the peak level at 5 tons per ha in 2023, and then reduced slightly in the following year.
Harvested Area
In 2024, the harvested area of paddy rice in Asia-Pacific stood at 143M ha, approximately mirroring 2023. Over the period under review, the harvested area recorded a relatively flat trend pattern. The pace of growth appeared the most rapid in 2020 when the harvested area increased by 2.7% against the previous year. The level of harvested area peaked at 143M ha in 2022; however, from 2023 to 2024, the harvested area remained at a lower figure.
Imports
Asia-Pacific’s Imports of Paddy Rice
In 2024, overseas purchases of paddy rice decreased by -7.9% to 1.2M tons for the first time since 2016, thus ending a seven-year rising trend. Over the period under review, imports, however, enjoyed a strong
expansion. The most prominent rate of growth was recorded in 2020 when imports increased by 109% against the previous year. Over the period under review, imports reached the peak figure at 1.3M tons in 2023, and then dropped in the following year.
In value terms, paddy rice imports expanded rapidly to $761M in 2024. Overall, imports, however, recorded resilient growth. The pace of growth was the most pronounced in 2022 when imports increased by 91%. Over the period under review, imports hit record highs in 2024 and are likely to see steady growth in the immediate term.
Imports By Country
Vietnam (660K tons) and Nepal (450K tons) prevails in imports structure, together creating 95% of total imports. The Philippines (26K tons) held a minor share of total imports.
From 2013 to 2024, the most notable rate of growth in terms of purchases, amongst the key importing countries, was attained by Vietnam (with a CAGR of +28.1%), while imports for the other leaders experienced more modest paces of growth.
In value terms, Vietnam ($453M) constitutes the largest market for imported paddy rice in Asia-Pacific, comprising 60% of total imports. The second position in the ranking was taken by Nepal ($124M), with a 16% share of total imports.
In Vietnam, paddy rice imports expanded at an average annual rate of +25.3% over the period from 2013-2024. The remaining importing countries recorded the following average annual rates of imports growth: Nepal (+11.0% per year) and the Philippines (+24.9% per year).
Import Prices By Country
In 2024, the import price in Asia-Pacific amounted to $651 per ton, with an increase of 15% against the previous year. Import price indicated measured growth from 2013 to 2024: its price increased at an average annual rate of +3.0% over the last eleven-year period. The trend pattern, however, indicated some noticeable fluctuations being recorded throughout the analyzed period. Based on 2024 figures, paddy rice import price increased by +56.5% against 2021 indices. The pace of growth was the most
pronounced in 2016 when the import price increased by 54%. As a result, import price reached the peak level of $727 per ton. From 2017 to 2024, the import prices failed to regain momentum.
There were significant differences in the average prices amongst the major importing countries. In 2024, amid the top importers, the country with the highest price was the Philippines ($3,810 per ton), while Nepal ($275 per ton) was amongst the lowest.
From 2013 to 2024, the most notable rate of growth in terms of prices was attained by Nepal (+1.5%), while the other leaders experienced mixed trends in the import price figures.
Exports
Asia-Pacific’s Exports of Paddy Rice
Paddy rice exports fell sharply to 998K tons in 2024, reducing by -15.4% on 2023 figures. Over the period under review, exports, however, enjoyed a buoyant expansion. The most prominent rate of growth was recorded in 2021 with an increase of 189% against the previous year. As a result, the exports attained the peak of 1.5M tons. From 2022 to 2024, the growth of the exports failed to regain momentum.
In value terms, paddy rice exports declined to $841M in 2024. In general, exports, however, recorded a strong increase. The growth pace was the most rapid in 2021 when exports increased by 189%. Over the period under review, the exports hit record highs at $852M in 2023, and then shrank modestly in the following year.
Exports By Country
Cambodia was the key exporting country with an export of around 633K tons, which resulted at 63% of total exports. It was distantly followed by India (306K tons), generating a 31% share of total exports. China (36K tons) followed a long way behind the leaders.
Cambodia was also the fastest-growing in terms of the paddy rice exports, with a CAGR of +71.3% from 2013 to 2024. At the same time, China (+6.7%) and India (+2.3%) displayed positive paces of growth. While the share of Cambodia (+63 p.p.) increased significantly in terms of the total exports from 2013-2024, the share of China (-2.1 p.p.) and India (-46.3 p.p.) displayed negative dynamics.
In value terms, Cambodia ($510M) remains the largest paddy rice supplier in Asia-Pacific, comprising 61% of total exports. The second position in the ranking was taken by India ($175M), with a 21% share of total exports. In Cambodia, paddy rice exports increased at an average annual rate of +70.4% over the period from 2013-2024. The remaining exporting countries recorded the following average annual rates of exports growth: India (+7.0% per year) and China (+8.8% per year).
Export Prices By Country
The export price in Asia-Pacific stood at $842 per ton in 2024, jumping by 17% against the previous year. Export price indicated a prominent increase from 2013 to 2024: its price increased at an average annual rate of +5.0% over the last eleven-year period. The trend pattern, however, indicated some noticeable fluctuations being recorded throughout the analyzed period. Based on 2024 figures, paddy rice export price increased by +75.2% against 2020 indices. The pace of growth was the most pronounced in 2022 an increase of 32%. The level of export peaked in 2024 and is expected to retain growth in years to come.
There were significant differences in the average prices amongst the major exporting countries. In 2024, amid the top suppliers, the country with the highest price was China ($3,918 per ton), while India ($571 per ton) was amongst the lowest.
From 2013 to 2024, the most notable rate of growth in terms of prices was attained by India (+4.6%), while the other leaders experienced mixed trends in the export price figures.
Source : Index Box