How India has become relatively atmanirbhar in Pulses compared to Edible Oil
There are two agricultural commodities in which India is significantly import-dependent: Edible oil and pulses.
Between 2013-14 and 2022-23 (April-March), the value of India’s vegetable oil imports has soared from $7,249.85 million (Rs 44,038.04 crore) to $20,837.70 million (Rs 167,269.99 crore). Much of this has been in just the last two fiscal years (chart 1). Source: Department of Commerce.
Out of the 24-25 million tonnes (mt) cooking oil that the country consumes annually, only 9-10 mt is from domestically produced grain. The balance 14-15 mt is imported.
Relatively atmanirbhar in pulses
It’s been quite the reverse with pulses.
The value of imports has posted only a marginal rise during the nine years of the Narendra Modi-led government: From $1,828.16 million (Rs 11,036.75 crore) to $ 1,943.89 million (Rs 15,780.56 crore). Imports went up initially to reach a high of $4,244.13 million (Rs 28,523.18 crore) in 2016-17, only to fall substantially thereafter (chart 2).
 Source: Department of Commerce.
In quantity terms, India’s imports of pulses more than doubled from 3.18 mt in 2013-14 to 6.61 mt in 2016-17. From those peaks, they have come down to 2.70 mt in 2021-22 and 2.52 mt in 2022-23. Thus, the nine years of the Modi government has actually seen a decline, unlike in vegetable oils, where the quantum of imports too has surged from 7.94 mt to 15.67 mt between 2013-14 and 2022-23.
The reduction in pulses imports have come essentially on the back of higher domestic production. According to the Agriculture Ministry, India’s pulses output has increased from 19.26 mt in 2013-14 to 27.50 mt in 2022-23. Private trade estimates of production are lower at 23-24 mt. Even taking 23 mt production and 2.5 mt imports translates into an atmanirbharta or self-sufficiency ratio of over 90% in pulses, as against hardly 40% for edible oils.
Chana shows the way
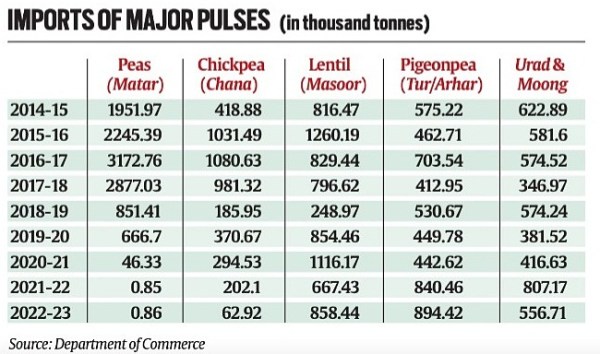
The accompanying table gives a breakup of India’s imports of major pulses.
ADVERTISEMENT
It can be seen that imports of two items have recorded dramatic drops: Yellow/white peas (matar) and chickpea (chana). At their height, yearly imports of the former topped 3 mt and the latter one mt. Those have since plunged to negligible levels.
The reason is simple. Yellow/white peas – imported mainly from Canada, Russia, Ukraine and Lithuania – are basically a substitute for chana. When chickpea prices went through the roof, as India’s production dipped from 9.53 mt in 2013-14 to 7.33 mt and 7.06 mt in the following two years, split yellow peas replaced chana dal in many curry recipes. There were even reports of besan (chana flour) makers resorting to adulteration by adding cheaper yellow/white matar. Imports of chickpea from Australia and Russia also spiraled during that period.
The situation changed after 2016-17, with domestic output of chana registering a jump to 11.38 mt in 2017-18 and further to 13.54 mt each in 2021-22 and 2022-23. While the trade’s estimate is only 11-12 mt, it is still a considerable improvement over the production in the initial years of the Modi government.
he boost to chana production came from two key government measures, incentivizing Indian farmers to expand area under the pulses crop grown during the rabi (winter-spring) season.
The first is the levy of a 60% import duty on chana since March 2018. In yellow/white peas, there is a 50% duty plus a minimum price of Rs 200/kg below which imports are not permitted, the latter imposed in December 2019. These have resulted in a near-complete stoppage of imports.
The second intervention has been government procurement at minimum support prices (MSP). Such purchases amounted to 2.14 mt in 2020 (the rabi marketing season from March-June), 0.63 mt in 2021, 2.56 mt in 2022 and 2.23 mt this year till May-end. The MSP of chana itself has been raised from Rs 3,100 to Rs 5,335 per quintal between 2013-14 and 2022-23.
Arhar is the problem
Chana’s success has, however, not been replicated for other pulses, particularly arhar/tur or pigeonpea. Its production has shown an erratic trend, rising from 3.17 mt in 2013-14 to 4.87 mt in 2016-17, before falling to 4.22 mt in 2021-22 and 3.43 mt in 2022-23. The trade, again, reckons this year’s crop at just 2.5 mt.
The same goes for urad (black gram), a predominantly kharif (post-monsoon sown) crop like arhar. Its output in the last four years has averaged 2.42 mt, down from the 3.49 mt and 3.06 mt highs of 2017-18 and 2018-19.