Preseason maize and wheat yield forecasts for early warning of crop failure

“A global analysis of sugarcane production under climate change” examines the impact of climate change on sugarcane production worldwide. Researchers used simulations to predict future yields, finding that climate change will lead to significant declines in sugarcane production, particularly in tropical regions. This has implications for global sugar supplies and food security.
Introduction
Early warning systems that produce accurate and timely information provide vital decision support for effective humanitarian responses to food crises. Many of the programs implemented by government and non-governmental organizations (NGOs) to anticipate and respond to food crises require months to plan and execute. Examples include the distribution of farming inputs and drought-tolerant seed ahead of the growing season, securing the funds needed for disaster response, procurement and distribution of food aid, and scaling up of nutrition assistance programs .
Anticipatory actions, such as the distribution of drought-tolerant seed varieties or switching to planting small grains on marginal lands instead of water-intensive crops can only be taken in advance of planting3. Even many disaster response policies, such as the shipment of in-kind food aid coming from the United States, to take one example, typically take around six months to reach target populations4.
Likewise, the logistics of scaling up nutrition assistance programs can take months due to the time required to obtain the funds needed to finance such an operation, plan and conduct nutrition surveys to identify vulnerable populations, and set up food distribution sites in targeted regions7. Even in the absence of exceptional funding needs, routine funding mechanisms for disaster response programs require months of advanced planning6.
Provided the considerable logistical challenges of anticipating and responding to disasters, there is a clear need for early warning information at lead times of six to twelve months. Crop yield forecasts made at these lead times could provide information on expected crop failures affecting the income of or food availability for vulnerable populations. But routine crop yield forecasts at lead times of a year do not currently exist. Research on crop yield forecast systems has been overwhelmingly focused on within-season forecasts, which are issued a few months prior to crop harvest, rather than preseason forecasts, which are issued prior to the start of the cropping season8,9. The primary utility of preseason forecast systems is that they issue forecasts several months earlier than within-season forecast systems10. Preseason crop yield forecasts do exist and have been proposed for sugarcane in South Africa11, maize in Zimbabwe12, wheat and sugarcane in Australia13,14,15, rice in the Philippines16, wheat, maize, and sugarbeet in Europe17,18, soybeans in the US19, and wheat, maize, rice, and soybeans at the global scale20,21,22,23.
To date, however, even these preseason crop yield forecast systems generally focus on lead times of only six months prior to the start of harvest due to the availability of climate forecasts at these lead times21,22. However recent advances in climate forecasts provide a means of extending preseason crop yield forecast lead times. In particular, skillful second-year forecasts of the El Niño Southern Oscillation (ENSO) have been developed using both machine-learning and model-analog-based methods24,25,26. Provided the widespread influence of ENSO on crop yields globally27,28,29,30 and its use in past preseason crop yield forecast systems12,16,18,22,23, this advance is highly relevant to the food security community.
In this article, we demonstrate that by leveraging the recent advances in ENSO forecasts, preseason crop yield forecasts are not only possible but are skillful over significant portions of cropland globally. In regions with strong ENSO teleconnections, both maize and wheat forecasts are skillful at lead times of up to a year ahead of harvest. Wheat forecasts, furthermore, remain skillful at lead times of over 18 months ahead of harvest in some countries. Our results demonstrate that the potential for preseason crop yield forecasts is greater than previously appreciated. Such forecasts require greater attention from the research community in order to support the next generation of operational food security early warning systems.
Results
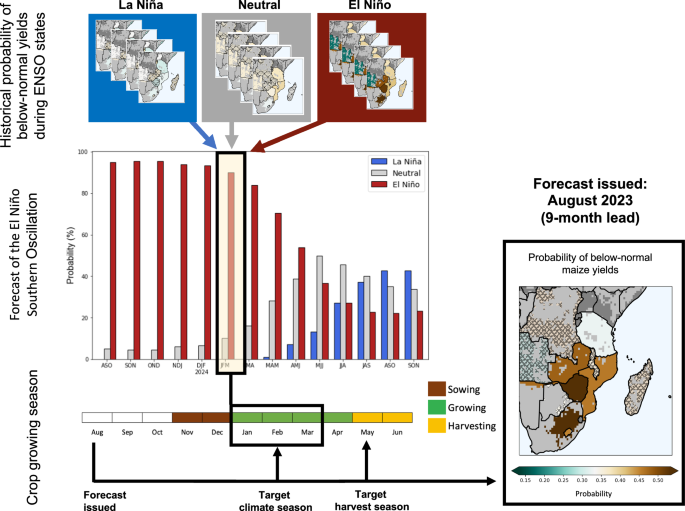
Provided that the El Niño Southern Oscillation (ENSO) strongly affects maize and wheat yields in many parts of the world27,28,30,31 and that ENSO forecasts have multiyear skill24,25,26,32, we propose a crop yield forecast system based on multiyear ENSO forecasts (Fig. 1). Our system combines the historical probability of below normal (bottom tercile) crop yield anomalies conditioned on ENSO phases with model-analog based ENSO forecasts32 during the crop growing season to forecast the likelihood that end-of-season yields will be below normal (see “Methods”).
Preseason forecast skill
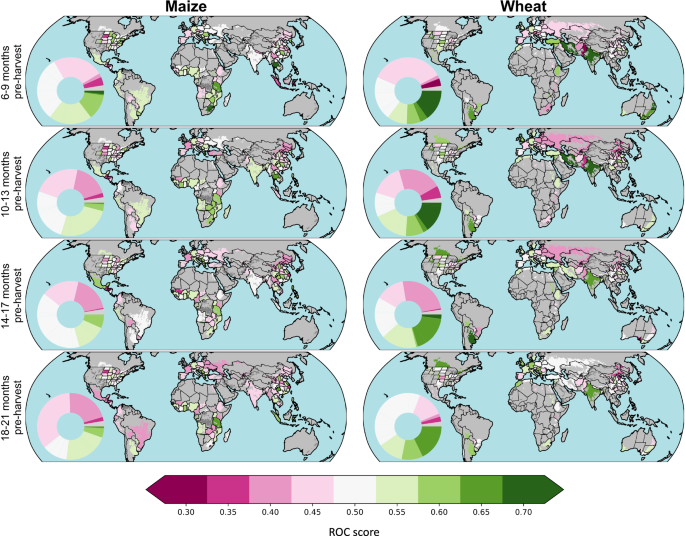
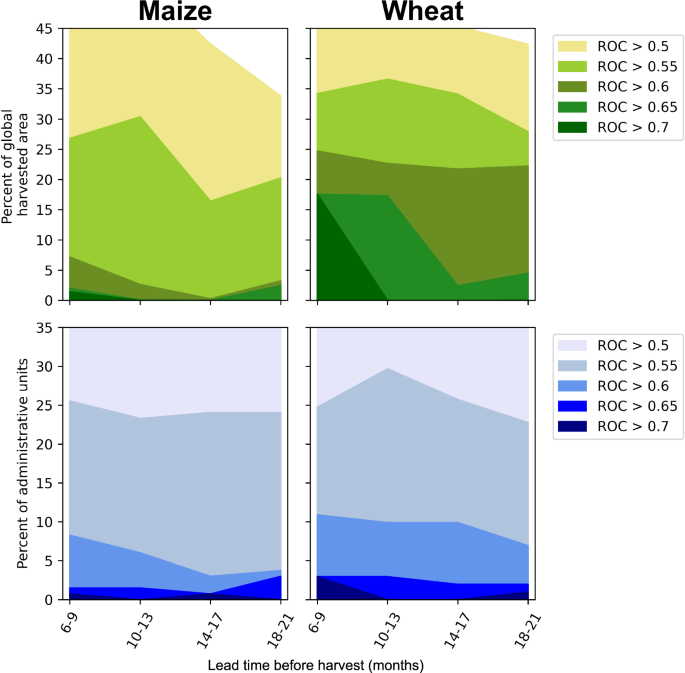
Figures 2 and 3 demonstrate that crop yield forecasts based solely on ENSO forecasts can make skillful preseason forecasts out to and beyond a year prior to harvest for both maize and wheat. Forecasts are most skillful for maize in Southeast Africa and Southeast Asia while for wheat they are most skillful in parts of South and Central Asia, Australia, and Southeast South America. A slightly larger share of global wheat production is grown in countries for which skillful forecasts can be made as compared to maize (Fig. 3). For wheat forecasts at a lead of 6–9 months before harvest, countries having relative operating characteristics (ROC) scores of over 0.55, 0.6, and 0.65 represent 34%, 25%, and 18% of wheat harvested areas, respectively. For maize forecasts at a lead of 6–9 months before harvest, countries having ROC scores of over 0.55, 0.6, and 0.65 represent only 27%, 7%, and 2% of maize harvested areas, respectively. Furthermore, skillful wheat forecasts (ROC > 0.6) tend to persist over ~20% of harvested areas out to leads of 18–21 months before harvest but forecasts with a ROC > 0.65 cover only ~5% of harvested areas for wheat at that lead time. Wheat and maize forecasts are skillful in roughly the same percentage of administrative units for which forecasts were made. Both wheat and maize forecasts have a ROC > 0.6 in ~8–12% of countries. That wheat forecasts are skillful over a greater fraction of harvested area is due to the concentration of wheat production in countries with forecast skill rather than the widespread presence of skill across wheat-producing countries. For wheat, the countries with ROC > 0.6 include major producing countries such as India, Australia, and Argentina, while for maize the most skillful forecasts are in Southeast Asia and Southeast Africa, which represent smaller portions of global maize production.
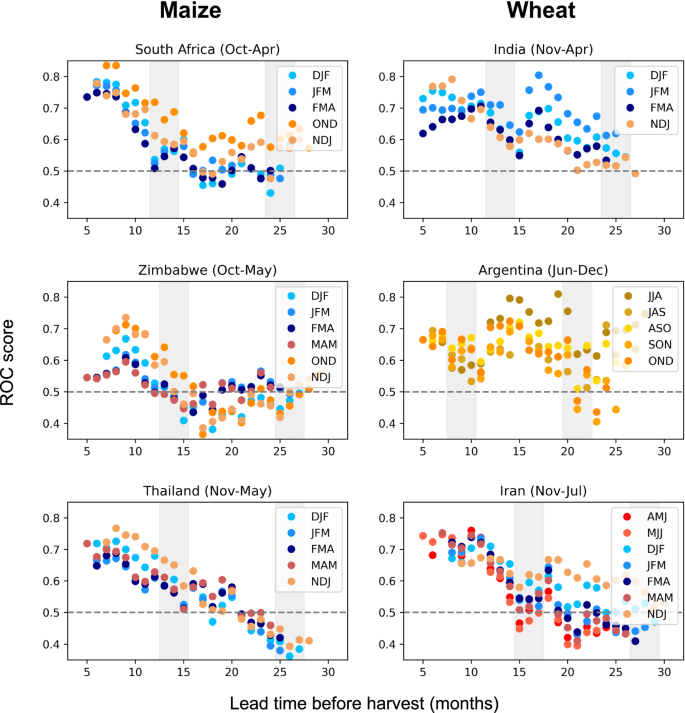
To better characterize forecast skills, we explore experiments that focus on the forecast lead time and the target season for which the forecast was made in individual countries. We find that the lead time at which forecast skill degrades depends on the country, crop, and month in which the forecast was issued (Fig. 4). Note that for each country the month in which the forecast is issued can also be described as the lead prior to harvest, so lead time can uniquely be converted into the calendar month in which the forecast was issued. For maize, forecast skill in South Africa and Thailand monotonically decline with increasing lead time until the forecasts become unskillful compared to a random forecast (ROC = 0.5), which occurs at a lead time of around 20 months ahead of harvest (Fig. 4). In some wheat producing countries, on the other hand, forecast skill declines more slowly and non-monotonically.
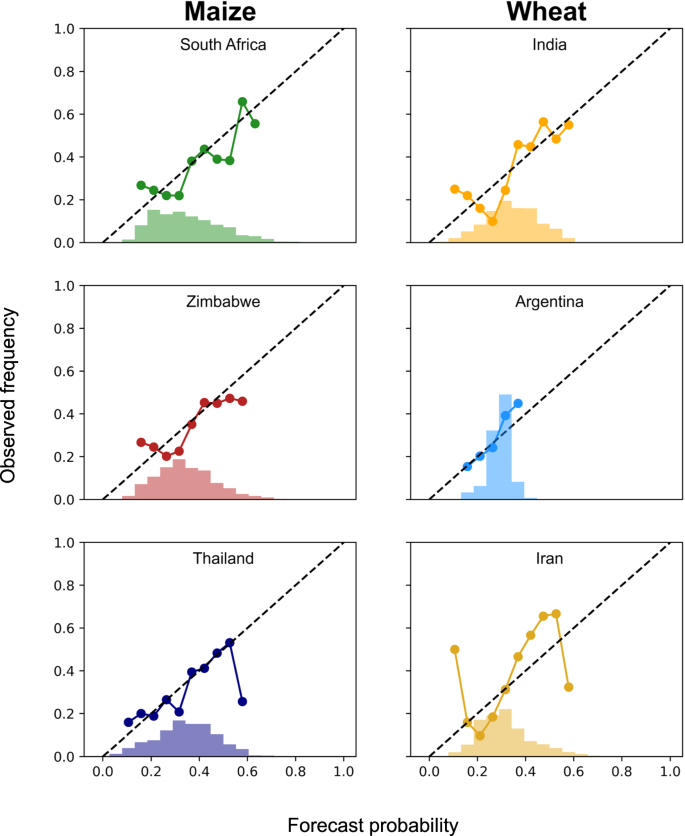
Where forecasts are skillful, they are often reliable as well, meaning that outcomes are observed with the same frequency as the forecast probability. Figure 5 shows reliability diagrams for some of the countries with moderate to good skill for both maize and wheat at leads of 10–13 months, see SI Figs. 1 and 2 for the same figure at 6–9 and 18–21 months. For both maize and wheat, the frequency of the observed outcomes generally well matches the forecasted probability of that event in South Africa, Zimbabwe, India, Argentina, and Thailand. In Iran, however, forecasts tend to be under-confident. In addition to reliable forecasts, the forecasts are quite sharp—meaning that forecasts differ significantly from climatology. With the exception of Argentina, the system issues forecasts that range from below 20% to over 60% for the countries in Fig. 5. In Argentina the forecasts at 10–13 month leads are reliable but rarely differ much from the baseline probability of a poor year (33%).
To demonstrate that our conclusions are robust to the sampling period, we repeat our analysis in major maize and wheat breadbaskets using subnational data starting in 1931, the earliest date for which data was available in all breadbaskets (SI Note 2). SI Fig. 3 demonstrates that even in the 85-year record, our conclusions remain true: crop yield forecasts for both maize and wheat are skillful at lead times of 10–13 months ahead of harvest, and wheat forecasts are skillful at longer lead times than are maize forecasts.
Factors affecting forecast skill
Some of the variations in crop yield forecast skill are attributable to the model-analog-based ENSO forecasts, which demonstrate variations in skill both as a function of issue month and lead time. Model-analog-based ENSO forecasts issued immediately prior to the spring predictability barrier (e.g., those issued Feb–Apr) have lower skill than ENSO forecasts issued outside of this period32. We identify the crop yield forecasts based on ENSO forecasts issued immediately prior to the spring predictability barrier with gray shading in Fig. 4. As expected, these forecasts correspond to a period of rapid decline in the skill of crop yield forecasts.
The model-analog-based ENSO forecasts also have non-monotonic skill declines with increasing lead time32. The skill of ENSO forecasts issued in late summer, for example, declines rapidly from leads 6–9 before increasing again out to lead 15. This increase in skill at longer lead times may account for the increase in skill at longer leads in our crop yield forecasts. However, because the observed increase of skill at longer leads is not well understood in the ENSO forecasts themselves, further research on physical mechanisms of the re-emergence of forecast skill in both ENSO and crop yield forecasts is necessary.
Finally, crop yield forecast skill beyond a year may be related to enhanced year-two predictability of La Niña events that follow strong El Niño events33. The persistence of skill in India, in particular, may arise from the fact that La Niña events nearly always result in normal to above-normal yields (SI Fig. 4). This relationship is stronger in India than in other countries with notable ENSO teleconnections (e.g., maize in South Africa). The reliability diagrams for forecasts at lead times of 18–21 months (SI Fig. 3) further support this mechanism. The forecasts in India remain sharp and reliable but the sharpness skews towards low probabilities. The skillful and reliable long-lead prediction of a low probability of poor yields is, therefore, consistent with skillful year-two forecasts of La Niña events that preclude poor yields in India.
Because grain crop yields are more vulnerable to abiotic stress during particular portions of the growing season34, it is possible that yield forecasts made using the climate conditions from those sensitive periods would be particularly skillful. To test this hypothesis, we evaluate the forecast skill separately for each 3-month climate season within the growing season rather than averaging them together as in previous analyses. Figure 4 confirms that forecast skill varies within the growing season for some countries. For example, in South Africa, forecasts for maize yields issued for the OND target season are consistently more skillful than those issued for later target seasons even at the same lead times. This target season-dependent skill is also apparent for maize in Thailand. For wheat, the dependence of forecast skill on target season is less clear although there is some relationship at longer lead times for India and Iran.
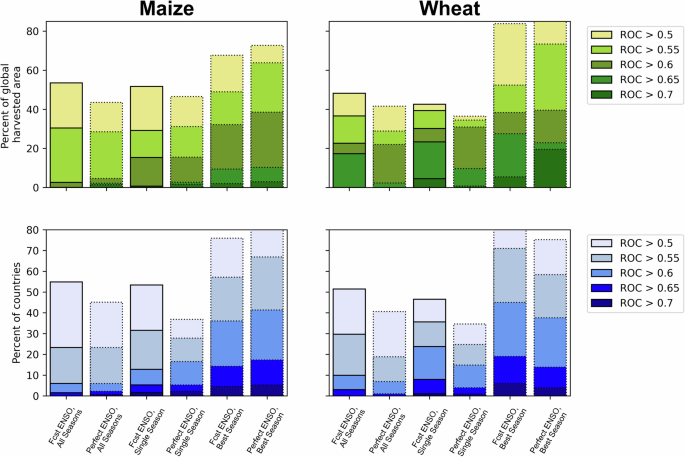
To test the extent to which our forecasts could be improved by better selecting target seasons or by improving ENSO forecasts themselves, we produce the following set of sensitivity experiments: (1) a ‘single season’ system in which a single target season is selected in a manner compatible with operational forecasts, (2) a ‘best season’ system in which the most skillful target season is selected a-posteriori, and (3) a ‘perfect ENSO forecast’ system that uses perfect deterministic information about ENSO phase rather than ENSO forecasts (see “Methods”). Figure 6 demonstrates that by selecting a single target season, even at lead times of 10–13 months before harvest, we can significantly increase the fraction of harvested areas with forecast skill (AUC > 0.6) in an operational context from 3% to 15% for maize and from 23% to 30% for wheat. While these improvements in skill are somewhat smaller than when the season that produces the highest skill is chosen a-posteriori, this is to be expected. And, notably, selecting a single season improves the forecast skill to comparable levels as being provides perfect information about the future categorical evolution of ENSO. By combining the a-posteriori season selection with perfect ENSO forecasts the system would provide skillful forecasts over 39% and 40% of maize and wheat harvested areas at a 10–13 month lead (Fig. 6). These numbers represent the ceiling for skillful forecasts using the present system.
Case study: a hindcast for the 1982 El Niño
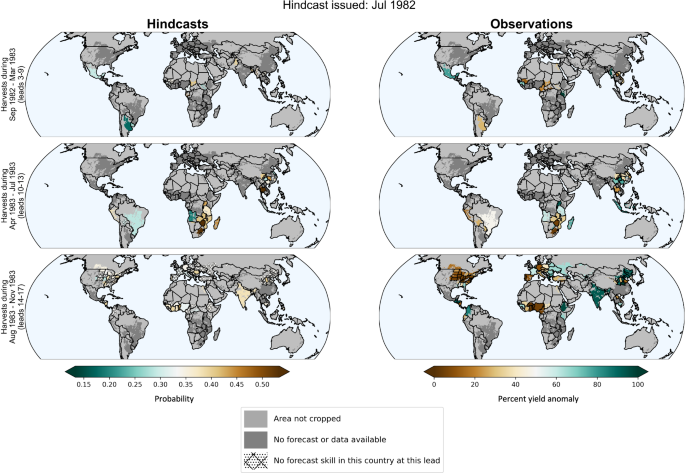
Finally, to demonstrate the promise and limitations of an ENSO-based forecast system in real-time, we show hindcasts for maize during the 1982/83 El Niño event in Fig. 7. We choose this event because it has been identified as the largest synchronous maize failure in the recent historical period35 and one in which ENSO played a major role organizing the global crop yield anomalies27. At lead times of 10–13 months ahead of harvest, the forecast system predicts the greatest probability of below-normal yields in Southeast Africa and Southeast Asia, both of which ended up experiencing below-normal yields. At 14–17 months, however, the system does not capture the below-normal yields in West Africa or the United States. At this lead time, the system does not issue skillful forecasts that differ much from climatology despite the large crop yield anomalies that eventually develop throughout the Northern Hemisphere. This return to climatological forecast odds at the 14–17 month lead is related to the ENSO forecast itself (SI Fig. 5), which shows a ~40% chance of La Niña and ~30% chance of neutral or El Niño developing during that lead time. This example highlights two important points: (1) because many factors affect crop yields, even during the strongest ENSO events a forecast system based only on ENSO will miss major crop yield failures and (2) an ENSO-based forecast system can be limited by the skill and sharpness of ENSO forecasts themselves in year two.
Discussion
This study finds that by leveraging recent advances in multiyear ENSO prediction, it’s possible to make skillful forecasts of both maize and wheat yields at lead times up to a year ahead of harvest. Crop yield forecasts for maize and wheat issued 10–13 months before harvest had skill over 15% and 30% of global croplands, respectively (Fig. 6). Forecasts for wheat were more skillful over a larger fraction of global cropland at all lead times than those for maize (Figs. 2 and 3). The spatial pattern of forecast skill follows from the locations where ENSO most strongly affects crop yield variance27, which is related to the strength, location, and timing of ENSO teleconnections relative to the climate-sensitive portions of the growing season29,30,36. Forecasts were most skillful for maize in Southeast Africa and Southeast Asia while for wheat they are most skillful in India, parts of Asia, Australia, and Southeast South America.
We found that skillful forecasts could be made over a much greater proportion of the global harvested area if the climate conditions during specific portions of the growing season were used rather than using the entire growing season (Figs. 4 and 6). We, therefore, recommend that future long-lead crop yield forecasting efforts consider identifying the portion of the growing season most relevant to connecting crop yields to climate conditions as a means of improving forecast skills.
Our study demonstrates both the promise and the limits of ENSO-based preseason crop yield forecasts. Even if provided with perfect information about the future evolution of ENSO, skillful forecasts cannot be made for more than ~40% of global harvested areas for both wheat and maize (Fig. 6). For wheat, the forecast skill of the current system is already nearing this limit at lead times of 10–13 months. From this we can conclude that improving year-one ENSO forecast skill is unlikely to greatly improve wheat yield forecasts, although as the case study demonstrates (Fig. 7 and Supplementary Information Fig. 5), improving year-two ENSO forecasts would improve long-lead crop yield forecasts. Based on these results, we recommend that preseason crop yield forecast systems incorporate modes of variability beyond ENSO to expand the area over which skillful forecasts can be made at lead times out to a year, while also recognizing that the ongoing improvements in year-two ENSO forecast skill will directly translate into improved year-two crop yield forecasts.
Whether preseason crop yield forecasts are presently skillful enough to inform decisions will depend on the region and lead time of the forecast, the proposed action, and the risk tolerance of the decision maker. The relatively higher forecast skill in Southern Africa, Australia, and parts of Asia may be suitable for anticipatory or response-related actions. But in regions where preseason forecasts have only marginal skill, the system is likely better suited to the ready-set-go framework for using seasonal forecasts37. This approach identifies low-cost actions—such as the updating of contingency plans (ready)—that can be taken using long-lead outlooks of a potential hazard. As the anticipated impact draws nearer and more skillful forecasts become available, local agencies may then prepare to implement those contingency plans (set) so that once the hazard arrives, appropriate action can be taken in a timely manner (go).
Finally, our analysis has a number of limitations that should be considered when interpreting the results. We build our crop yield forecast system mostly on country-level Food and Agriculture Organization (FAO) crop yield statistics, which have known issues such as the random errors introduced by a reduced capacity of the FAO to accurately collect country-level data in Africa38 and the systematic errors introduced by over-reporting of achievements39. We minimize these effects through our quality control procedures, by investigating only deviations from long-term trends, and by using as many ENSO years as possible in formulating and evaluating our model. However, our results should still be considered in light of the limitations of imperfect data.
The research community has not yet identified the intrinsic limits of skillful preseason crop yield forecasts. We demonstrate this by using an ENSO-based forecast system to produce skillful crop yield forecasts at lead times of over a year ahead of harvest. That a forecast system as simple as ours produces skillful forecasts at unprecedented lead times illustrates the extent to which preseason crop yield forecasts have been neglected in the research community. Provided recent advances in both climate forecasting methods and crop yield forecasting methods, there is significant potential for developing preseason crop yield forecast systems that are skillful enough to be a useful component of early warning systems.
Methods
Crop yield statistics
We use crop yield data from both the 20th Century Crop Yield Statistics v1 (see SI Note 2), which consists of subnational data from 1920–2017 in all major wheat and maize bread baskets for which data was available31,40, and the FAO country-level crop yield data from 1961 to 202141. We chose these two datasets because they are available for relatively long time periods, which is critical to training and evaluating the performance of our model.
Crop calendars and crop masks
To identify the location of crop growing areas we use the GEOGLAM crop masks for maize and wheat42. For crop calendars, we use the vegetative to the reproductive stage of the GEOGLAM main season for both maize and wheat. The exception to this is Brazil, Kenya, and Somalia. In Brazil, we use the second maize season because it was, for the majority of our study period, the primary maize production season until the second safrinha-cycle planting became the larger of the two production seasons around 201029. In Kenya and Somalia, we use the short-rains season, which is the smaller of the two maize production seasons, as the target season because it is strongly affected by ENSO and generally has greater interannual variability as compared to the long rains season. For wheat, we use the winter wheat season from GEOGLAM as the main season in all countries except Canada and Yemen, for which we use the spring wheat growing season as the main season.
Observations and forecasts of ENSO
To identify the historical evolution of ENSO we use the Oceanic Niño Index (ONI), which measures anomalies in the sea surface temperature (SST) in the Niño 3.4 region (5°N–5°S, 120°–170°W) in the ERSSTv5 dataset43. We calculate anomalies using a 30-year “fair-sliding” climatology behind the forecast period so that model performance is evaluated in a manner consistent with a routine forecast system44 as in ref. 32. For ENSO forecasts we use the NOAA/PSL and University of Colorado/CIRES ‘model-analog’ forecasts, which have comparable skill to operational initialized forecast models24,25. The benefits of a model-analog approach include the availability of an extensive hindcast record dating back to the 1850s and the availability of forecasts at leads up to two years32. The long time series and extensive set of hindcasts allow us to evaluate forecasts for all years for which crop yield data is available.
Crop yield anomaly time series
Because the FAO dataset provides estimates of crop yields even when data is not available, some quality screening of the data is necessary as a first step. Any yield value in the FAO dataset with the data quality flag ”imputed value” or ”missing value” is removed from our analysis. We then screen the FAO data to remove values with unrealistically low variance relative to a trend based on second differences of the yield time series. This was necessary because at times FAO data appears to be filled using a trend (e.g., a constant second-difference) without an associated data quality flag (see SI Note 1 and SI Fig. 6). We flag any of the second differences in which four consecutive values were less than 50 kg/ha as being unrealistically low. This is equivalent to identifying at least five values that didn’t meaningfully deviate from the yield trend. While the exact threshold used is subjective, we found 50 kg/ha to be a threshold that removed many of the most likely in-filled values without erroneously removing values in low-variance production systems with higher data quality, such as heavily irrigated wheat in India. SI Fig. 6 shows six examples of countries with values that were flagged and removed (highlighted areas) for wheat and maize. Finally, we correct a reporting issue for wheat in Argentina (see Supplementary Information). Following quality controls, we remove any country that has fewer than five years of data remaining.
To produce continuous, homogenous time series it is necessary to combine a number of countries from the FAO data into aggregate groups to account for changes in national boundaries over time. In particular, we group the following nations together: the countries that make up the former USSR, Sudan and South Sudan, Yugoslavia, Belgium-Luxembourg, and Czechoslovakia. Following this procedure, we recompute aggregate yields by dividing reported production by reported harvested area.
We supplement the FAO data with subnational data in the United States, China, and Australia with data collated in the 20th Century Crop Yield Statistics v131,40 and updated to 2020. We use total wheat statistics in China and the United States to match the FAO data, which presents data only for combined seasons and combined sub-crops.
For both crop yield datasets, we use a low-frequency Gaussian filter with a kernel standard deviation of three years to calculate expected yields. We then calculate the percent yield anomalies as below:
Yai=100∗(Yi−Yei)/(Yei)
where Yai is the yield anomaly in year i, Yi is the yield value in year i, and Yei is the expected yield in the year i. We find that our results remain largely the same when using a five-year running mean to define the expected yield instead of a low-frequency Gaussian filter (results not shown). We use percent yield anomalies rather than absolute yield anomalies to account for the increase in yield variance that accompanies increases in absolute yields over time45. To align the crop harvest season with the ENSO forecasts, we identify the growing seasons for each crop in each country that span the calendar year to ensure that forecasts made for those seasons at the end of one calendar year correctly align with the yield value, which is reported in FAO statistics as the harvest year.
Climate forecasts
Our climate forecasts are only issued prior to the start of the growing season, meaning we do not produce forecasts for crops and countries in which the vegetative season has already begun. We refer to our forecasts as ’preseason’ to differentiate them from crop yield forecasts made for end-of-season yields based on observations of moisture availability and vegetative health during the growing season. We choose to exclusively produce preseason forecasts rather than continuing to issue forecasts throughout the growing season because we anticipate that the usefulness of climate forecast-based yield predictions will be primarily prior to the start of the vegetative phase and/or the rainy season. Once the growing season is significantly underway, we expect earth observation-based forecasts to be a more accurate representation of the likely end-of-season yield outcome in a country. A consequence of this decision is that nearly all of our forecasts are at leads longer than five months prior to harvest. This distinguishes our forecasts from past efforts, which make forecasts for a crop up until harvest.
For a given ENSO forecast in a given target season, we first identify the countries that will have crops that are in-season during the target season, which we define as countries with the majority (>50% of the harvested area) of the main season maize or wheat in the vegetative to reproductive phase using the GEOGLAM crop calendars and crop masks. Note that we exclude countries where the crop is currently in season even if it will also be in season during the target season. We choose the vegetative to reproductive period because grain crops are particularly vulnerable to abiotic stresses during the reproductive and grain-filling stages of crop growth34.
For each country with a valid in-season crop, we produce a forecast of the probability of below-normal crop yields as follows: (1) separate historical crop yield anomalies into terciles corresponding to above-normal, normal, and below normal, (2) identify historical years in which ENSO was active in each phase (El Niño, La Niña, neutral) for the given target season, (3) separate the country’s crop yield anomalies according to the ENSO phase in each year of the historical record to calculate the probability that the crop yield is in the below normal tercile given the ENSO phase, and (4) linearly combine each of the three conditional probabilities proportional to the forecast probability of that phase of ENSO occurring in the target season. This can be written as follows:
where Pybni is, for target season i, the issued forecast probability that the yield is in the below normal tercile, pENi is the probability that ENSO is in the El Niño phase during target season i, and (Pybn∣EN) is the historical probability that yields are below normal given that ENSO is in the El Niño phase during the 3-month target season i. For each country and crop in a given year, the system issues forecasts for all overlapping 3-month target seasons within the vegetative period of the growing season. This is done to reflect the forecasted evolution of the tropical Pacific throughout the vegetative season. For each lead prior to harvest, therefore, we average all forecasts issued for the growing season so that the system issues a single forecast probability for a growing season.
Note that throughout this article we refer to lead time as the time between when the forecast is issued and the start of harvest, not the time between when a forecast is issued and the target season (see Fig. 1). For example, two forecasts issued in August with target seasons of JFM and FMA for a harvest occurring in May will both have a lead time of nine months. We use this notation because the target quantity of our forecasts is the end-of-season crop yields, not the mid-growing-season ENSO state on which the forecasts are conditioned.
Conceptually, our model can be considered as a formalization of the expectation for below-normal crop yields based on a linear combination of historical observations relative to the forecasted evolution of ENSO. While conceptually straightforward, it provides a powerful benchmark forecast to take advantage of the known predictability of ENSO and of known ENSO teleconnections to crop yields while also accounting for the uncertainty of the evolution of the tropical Pacific on multiyear time scales.
Skill evaluation
We use a probabilistic categorical model for our preseason forecasts because such a model recognizes that although forecasts of precise crop yields are likely impossible at such long leads, there may still be predictable shifts in the distribution of yield outcomes. Such probabilistic categorical models are widespread in the climate forecasting community, but are not commonly applied to crop yield forecasts. A further advantage of such categorical forecasts is that they account for the low precision of FAO crop yield estimates in many parts of the world by requiring only that the observations are precise enough to place the year in the correct tercile.
We evaluate forecast skill in a hold-one-out cross-validation approach using the ROC score, which measures the ratio of the hit rate to the corresponding false alarm rate of a categorical forecast46. The area under the ROC curve is a measure of forecast discrimination or, put another way, a measure of whether a forecast differs given different outcomes. A ROC score of 0.5 or lower indicates a forecast model with no skill, while a score of 1 indicates a perfect forecast model. We follow the conventions of ref. 21, who previously evaluated probabilistic global crop yield forecasts, in defining forecasts with an ROC > 0.6 as having skill. For countries with skillful forecasts, we furthermore present metrics on forecast reliability, which measures whether observed outcomes are conditioned on issued forecast probabilities. A reliability diagram plots the forecast probability against the frequency of an observed outcome. All analyses of reliability and skill evaluations are conducted separately for wheat and maize in each country at a variety of lead times.
Single-season and best-season experiments
To test the improvement in skill when targeting a specific season within the growing season we configure the model to identify and use ENSO forecasts for a single target season within the growing season rather than using all target seasons. We do so within the leave-one-out cross-validation framework by using only the training data (not the withheld test year) to correlate observed crop yields with observed Niño 3.4 SST anomalies using a Spearman rank correlation for each three-month season in the growing season. We then use the season with the greatest absolute correlation that was determined from our training data as our single target season to predict the test data year.
To test the potential improvements to be gained by selecting a single target season rather than using all seasons we conduct an a-posteriori evaluation of the all-seasons model by selecting a single target season for each country based on the ROC score of the model using each individual target season at leads of 6–13 months. This a-posteriori analysis represents the maximum potential benefit of using a single target season configuration in the model system.
Source Link : https://www.nature.com/articles/s41467-024-51555-8